Dolzarb patternlar
Паттерны – это графические модели, которые "рисует" цена на графике. Один из постулатов технического анализа говорит нам о том, что история (движение цены) всегда повторяется. Это значит, что в похожих ситуациях движение цены, зачастую, будет похожим, что позволяет с высокой долей вероятности спрогнозировать дальнейшее развитие ситуации.
Актуальные паттерны
- Все
- Вымпел
- Голова и плечи
- Двойная вершина
- Прямоугольник
- Треугольник
- Тройная вершина
- Флаг
- Все
- #AAPL
- #AMZN
- #Bitcoin
- #EBAY
- #FB
- #GOOG
- #INTC
- #KO
- #MA
- #MCD
- #MSFT
- #NTDOY
- #PEP
- #TSLA
- #TWTR
- AUDCAD
- AUDCHF
- AUDJPY
- AUDUSD
- EURCAD
- EURCHF
- EURGBP
- EURJPY
- EURNZD
- EURRUB
- EURUSD
- GBPAUD
- GBPCHF
- GBPJPY
- GBPUSD
- GOLD
- NZDCAD
- NZDCHF
- NZDJPY
- NZDUSD
- SILVER
- USDCAD
- USDCHF
- USDJPY
- USDRUB
- Все
- M5
- M15
- M30
- H1
- D1
- Все
- Покупка
- Продажа
- Все
- 1
- 2
- 3
- 4
- 5
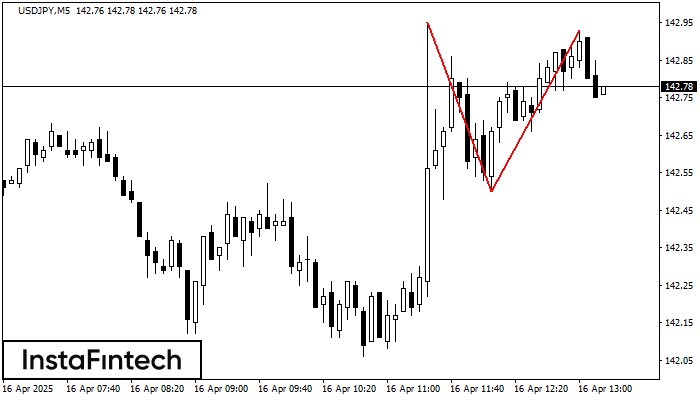
На торговом графике USDJPY M5 сформировалась разворотная фигура «Двойная вершина». Характеристика: Верхняя граница 142.93; Нижняя граница 142.50; Ширина фигуры 43 пунктов. Сигнал: Пробой нижней границы 142.50 приведет к дальнейшему нисходящему
Таймфреймы М5 и М15 могут иметь больше ложных точек входа.
Открыть график инструмента в новом окне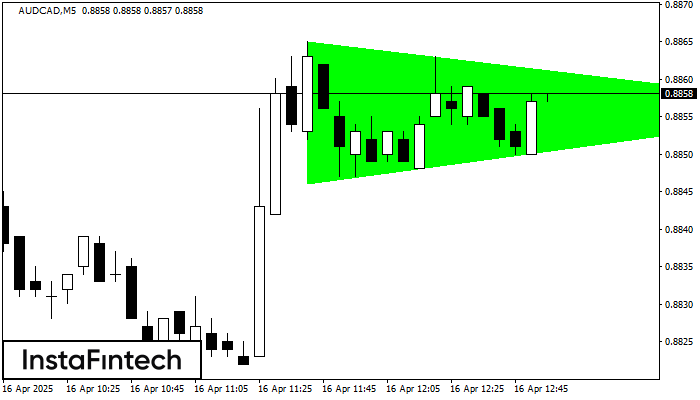
По AUDCAD на M5 сформировалась фигура «Бычий симметричный треугольник», которая сигнализирует нам о продолжении тенденции. Характеристика: Верхняя граница фигуры имеет координаты 0.8865/0.8856; Нижняя граница 0.8846/0.8856; Проекция ширины фигуры 19 пунктов
Таймфреймы М5 и М15 могут иметь больше ложных точек входа.
Открыть график инструмента в новом окне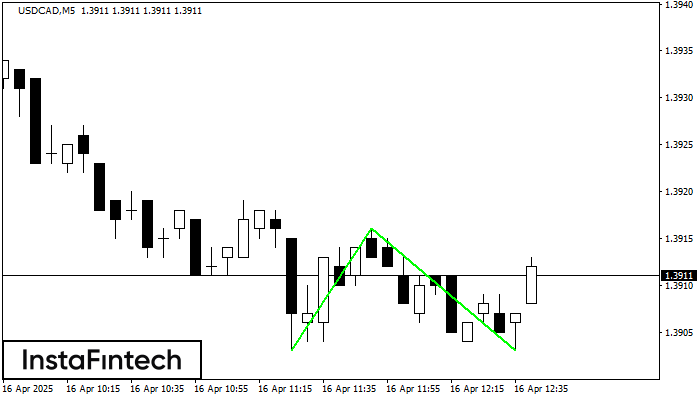
Сформирована фигура «Двойное дно» на графике USDCAD M5. Верхняя граница 1.3916; Нижняя граница 1.3903; Ширина фигуры 13 пунктов. В случае пробоя верхней границы 1.3916 можно будет прогнозировать изменение тенденции
Таймфреймы М5 и М15 могут иметь больше ложных точек входа.
Открыть график инструмента в новом окне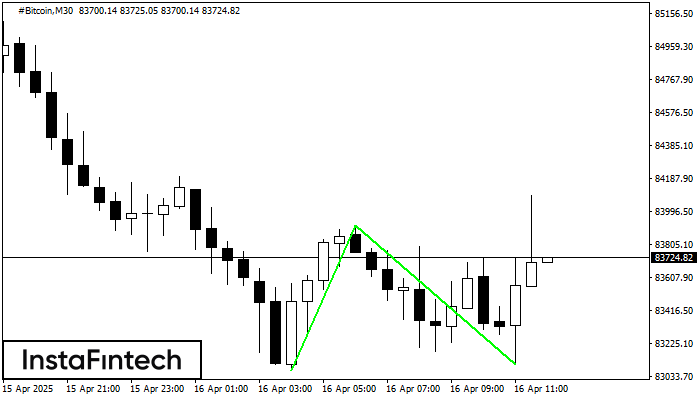
Сформирована фигура «Двойное дно» на графике #Bitcoin M30. Верхняя граница 83915.56; Нижняя граница 83100.24; Ширина фигуры 84817 пунктов. В случае пробоя верхней границы 83915.56 можно будет прогнозировать изменение тенденции
Открыть график инструмента в новом окне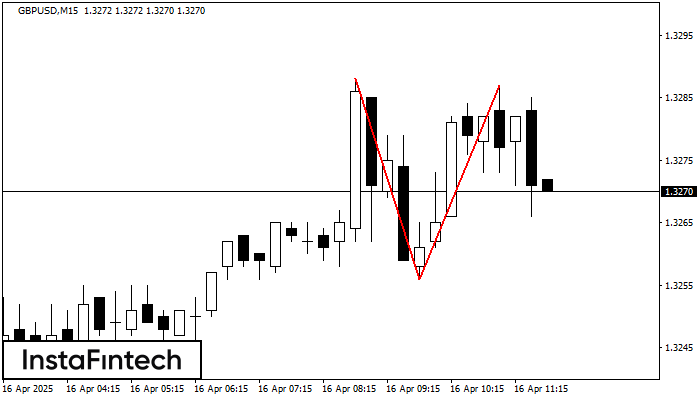
По GBPUSD на M15 сформировалась разворотная фигура «Двойная вершина». Характеристика: Верхняя граница 1.3288; Нижняя граница 1.3256; Ширина фигуры 31 пунктов. Позицию на продажу возможно открыть ниже нижней границы 1.3256
Таймфреймы М5 и М15 могут иметь больше ложных точек входа.
Открыть график инструмента в новом окне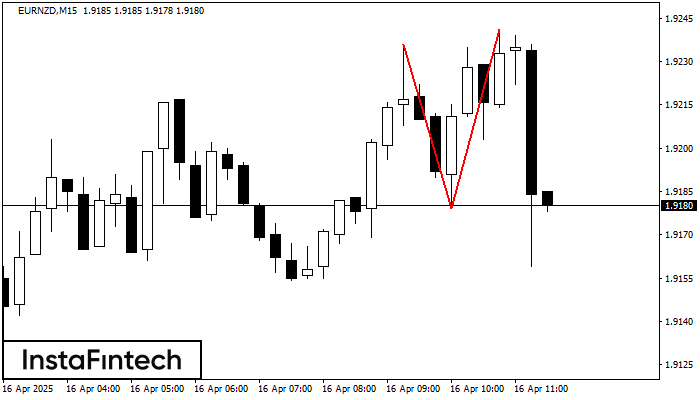
По EURNZD на M15 сформировалась разворотная фигура «Двойная вершина». Характеристика: Верхняя граница 1.9236; Нижняя граница 1.9179; Ширина фигуры 62 пунктов. Позицию на продажу возможно открыть ниже нижней границы 1.9179
Таймфреймы М5 и М15 могут иметь больше ложных точек входа.
Открыть график инструмента в новом окне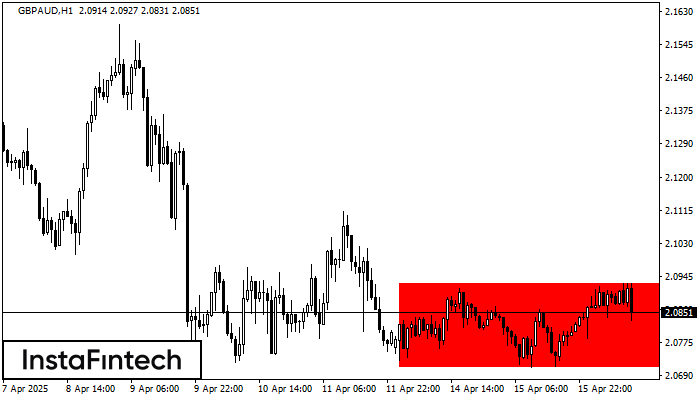
Сформирована фигура «Прямоугольник» на графике GBPAUD H1. Тип фигуры: Продолжение тренда; Границы: Верхняя 2.0927, Нижняя 2.0711; Сигнал: позиция на продажу открывается после фиксации цены ниже границы прямоугольника 2.0711
Открыть график инструмента в новом окне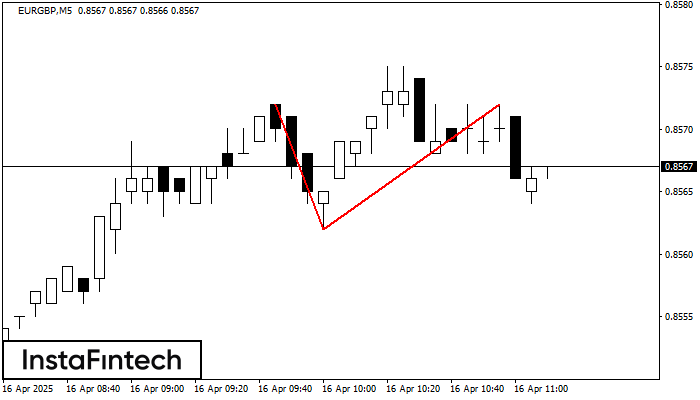
По EURGBP на M5 сформировалась разворотная фигура «Двойная вершина». Характеристика: Верхняя граница 0.8572; Нижняя граница 0.8562; Ширина фигуры 10 пунктов. Позицию на продажу возможно открыть ниже нижней границы 0.8562
Таймфреймы М5 и М15 могут иметь больше ложных точек входа.
Открыть график инструмента в новом окне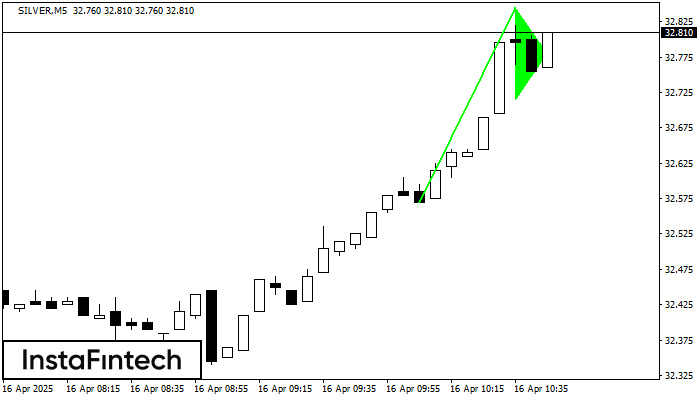
На графике SILVER M5 сформировался паттерн «Бычий вымпел», который относится к фигуре продолжения тренда. Можно предполагать, что, в случае фиксации цены выше максимума вымпела 32.84, возможно дальнейшее восходящее движение
Таймфреймы М5 и М15 могут иметь больше ложных точек входа.
Открыть график инструмента в новом окне