empty
13.11.2023 12:31 PM
Weekly forecast based on simplified wave analysis: GBP/USD, AUD/USD, USD/CHF, EUR/JPY, AUD/JPY, and US dollar index from November 13th

GBP/USD

Brief Analysis:

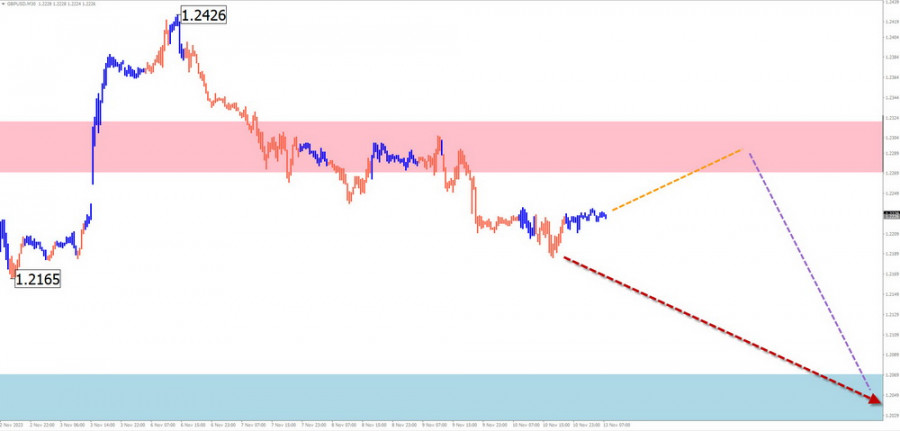
The short-term trend of the British pound has been determined by a bearish wave since mid-summer. The structure initiated the intermediate part (B) on October 4. The downward segment from November 6 has a reversal potential. Quotes are within the potential reversal zone on a weekly scale. Before continuing the trend, the price needs to be corrected.

Weekly Forecast:

The beginning of the upcoming week is expected to be flat. Price movements of the pound are likely to be in a sideways range along the resistance zone. Subsequently, a downward vector can be expected. The calculated support is located at the accumulation of potential reversal zones of different scales.

This image is no longer relevant

Potential Reversal Zones:

Resistance:

  • 1.2270/1.2320

Support:

  • 1.2070/1.2020

Recommendations:

Sales: Possible with a fractional lot in separate sessions after signals from your trading system near the resistance zone appear.

Purchases: Not recommended until the completion of the upcoming correction.

AUD/USD

Brief Analysis:

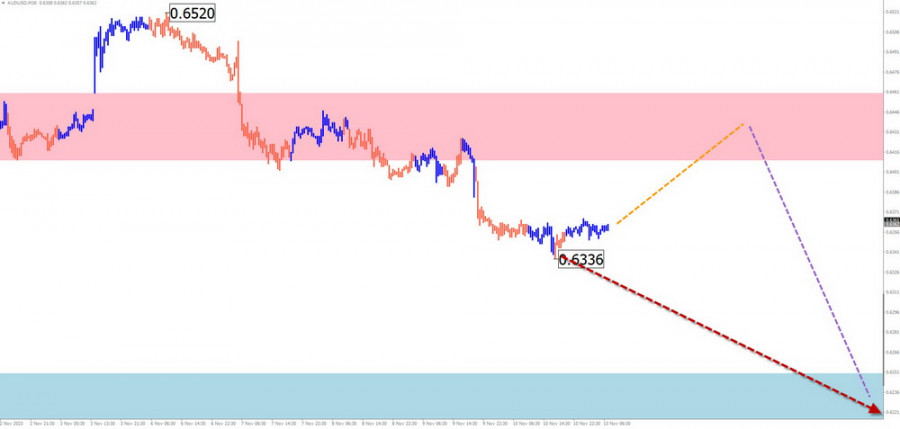
Within the dominant bearish trend, the quotes of the Australian dollar have been forming a corrective segment since October. Its magnitude does not exceed the correction level of the last part of the main wave. The downward segment from November 6 has a reversal potential. Upon confirmation, it will begin a new part of the main trend.

Weekly Forecast:

A sideways price vector is probable at the beginning of the upcoming week. Short-term growth is possible within the calculated support boundaries. Increased volatility and a resumption of downward price movement can be expected closer to the weekend. The support level demonstrates the lower boundary of the expected weekly range.

This image is no longer relevant

Potential Reversal Zones:

Resistance:

  • 0.6410/0.6460

Support:

  • 0.6250/0.6200

Recommendations:

Purchases: Risky. Due to the limited upward potential, there is a high probability of deposit loss.

Sales: This will become relevant after the appearance of corresponding signals in your used trading systems near the resistance zone.

USD/CHF

Brief Analysis:

The analysis of the daily chart of the Swiss Franc shows the formation of a downward wave since November. Since July 14, the price has been correcting upward towards the main movement. The structure of this wave needs to be completed. The nearest target is the preliminary target zone, the upper limit indicated by the level of calculated support.

Weekly Forecast:

The pair's price is expected to decline throughout the current week, reaching the support zone. At the beginning of the week, a short-term price rollback upward to the resistance zone is not ruled out. The greatest activity can be expected in the second half of the week.

This image is no longer relevant

Potential Reversal Zones:

Resistance:

  • 0.9080/0.9130

Support:

  • 0.8790/0.8740

Recommendations:

Purchases: Not relevant in the coming days.

Sales: This can be used for trading after the appearance of confirmed signals in the resistance zone.

EUR/JPY

Brief Analysis:

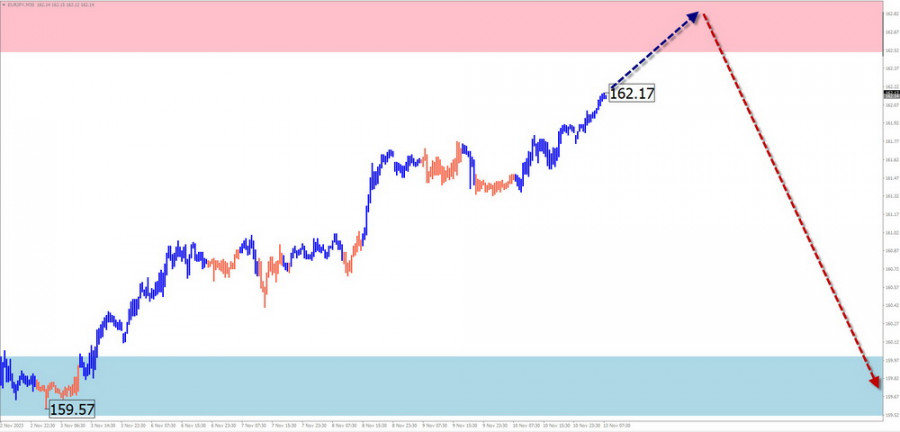
The unfinished wave structure of the euro against the Japanese yen's chart is directed upward and has been counting since July 28. Since the beginning of last month, the price has been forming the final part of the wave (C). The wave structure needs to look complete. Quotes are approaching the upper limit of the potential reversal zone on a weekly timeframe.

Weekly Forecast:

In the next couple of days, one can expect the continuation of the pair's price increase. A breakthrough beyond the resistance zone is unlikely. Towards the end of the week, against the backdrop of increased volatility, a change in direction and a resumption of price decline are expected. The calculated support indicates the lower boundary of the expected weekly range.

This image is no longer relevant

Potential Reversal Zones:

Resistance:

  • 162.50/163.00

Support:

  • 160.00/159.50

Recommendations:

Sales: Will become relevant after the appearance of reversal signals in your trading systems in the resistance zone.

Purchases: Can be used with a fractional lot in separate trading sessions.

AUD/JPY

Brief Analysis:

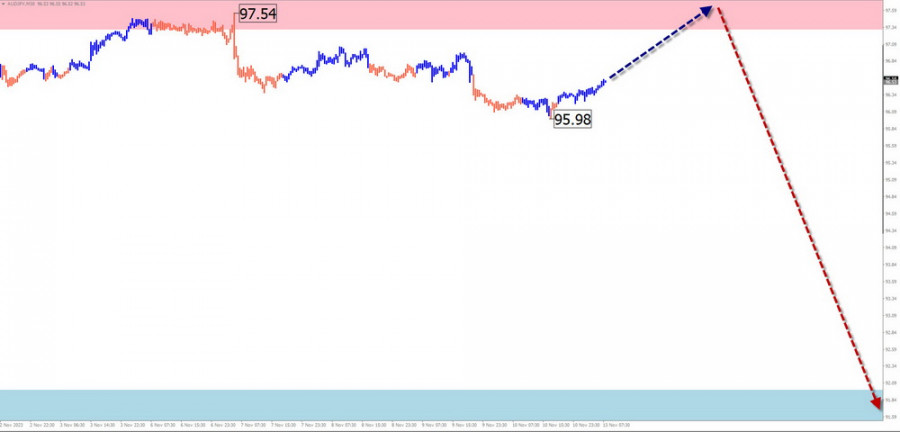
A flat price movement has been observed in recent months on the chart of the Australian Dollar against the Japanese yen. The unfinished wave structure has been downward since June 16. In its structure, the intermediate part (B) is approaching completion. The price is at the lower boundary of a strong resistance. There are no signals of an imminent reversal on the chart.

Weekly Forecast:

In the next few days, the most likely scenario will be an attempt to exert pressure on the resistance zone. Subsequently, one can expect a change in direction and the course of the cross towards the calculated support.

This image is no longer relevant

Potential Reversal Zones:

Resistance:

  • 97.30/97.80

Support:

  • 92.00/91.50

Recommendations:

Sales: This will become relevant after confirmed reversal signals appear in the resistance zone.

Purchases: The potential is limited by resistance. Transactions may become unprofitable.

US Dollar Index

Brief Analysis:

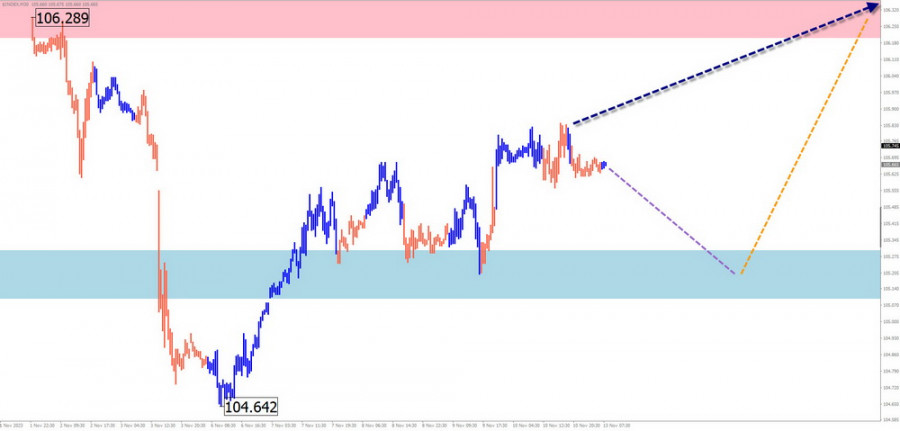
The quotes of the US Dollar have been regaining lost positions since mid-July. In the area of strong resistance, the price has been forming an upward correction since the beginning of October. Its structure looks completed at the time of the analysis. The upward segment from November 6 has a reversal potential. Upon confirmation, it will mark the beginning of the final part of the wave (C).

Weekly Forecast:

The index quotes may decline in the next few days, reaching the calculated support. After that, a sideways movement along its boundaries is expected to form a reversal and a rollback of upward index values. The limiting zone of the rise is the calculated resistance.

This image is no longer relevant

Potential Reversal Zones:

Resistance:

  • 106.20/106.40

Support:

  • 105.30/105.10

Recommendations:

Sales: Selling currencies in major pairs may be possible with a reduced lot in separate trading sessions.

Purchases: Purchases of national currencies will become relevant after the completion of the upcoming correction of the dollar index.

Note: In simplified wave analysis (SWA), all waves consist of 3 parts (A-B-C). The last unfinished wave is analyzed on each timeframe. Dashed lines indicate expected movements.

Attention: The wave algorithm does not consider the duration of instrument movements over time!

เลือกช่วงเวลา
5
นาที
15
นาที
30
นาที
1
ชั่วโมง
4
ชั่วโมง
1
วัน
1
สัปดาห์
รับผลกำไรจากการเปลี่ยนแปลงอัตราสกุลเงินดิจิทัลกับ InstaForex.
ดาวน์โหลด MetaTrader 4 และเปิดการซื้อขายครั้งแรกของคุณ.
การวิเคราะห์ EUR/USD - 31 มีนาคม โครงสร้างคลื่นบนแผนภูมิ 4 ชั่วโมงของ EUR/USD กำลังมีความเสี่ยงที่จะเปลี่ยนรูปร่างเป็นรูปแบบที่ซับซ้อนยิ่งขึ้น ในวันที่ 25 กันยายนปีที่ผ่านมา โครงสร้างลดลงใหม่เริ่มที่จะการสร้างและอยู่ในรูปแบบของลัพธ์คลื่นห้า สามเดือนที่ผ่านมา โครงสร้างแก้ไขขึ้นเริ่มที่จะการสร้างในที่ควรจะประกอบด้วยคลื่นอย่างน้อยสามคลื่น โครงสร้างของคลื่อแรกถูกสร้างขึ้นอย่างดีและจึงทำให้ฉันคาดว่าคลื่นที่สองจะต้องมีรูปร่างที่ชัดเจนเช่นเดียวกัน อย่างไรก็ตาม ขนาดของคลื่นนี้ใหญ่มากจนเป็นอันตรายถ้ามันเปลี่ยนรูปแบบคลื่นอย่างมาก ข่าวสารที่ส่งออกมายังคงสนับสนุนผู้ขายมากกว่าผู้ซื้อเมื่อมาถึงข้อมูลทางเศรษฐกิจ
  • Grand Choice
    Contest by
    InstaForex
    InstaForex always strives to help you
    fulfill your biggest dreams.
    เข้าร่วมการแข่งขัน


บทความแนะนำ

การวิเคราะห์ EUR/USD - 31 มีนาคม

โครงสร้างคลื่นบนแผนภูมิ 4 ชั่วโมงของ EUR/USD กำลังมีความเสี่ยงที่จะเปลี่ยนรูปร่างเป็นรูปแบบที่ซับซ้อนยิ่งขึ้น ในวันที่ 25 กันยายนปีที่ผ่านมา โครงสร้างลดลงใหม่เริ่มที่จะการสร้างและอยู่ในรูปแบบของลัพธ์คลื่นห้า สามเดือนที่ผ่านมา โครงสร้างแก้ไขขึ้นเริ่มที่จะการสร้างในที่ควรจะประกอบด้วยคลื่นอย่างน้อยสามคลื่น โครงสร้างของคลื่อแรกถูกสร้างขึ้นอย่างดีและจึงทำให้ฉันคาดว่าคลื่นที่สองจะต้องมีรูปร่างที่ชัดเจนเช่นเดียวกัน อย่างไรก็ตาม ขนาดของคลื่นนี้ใหญ่มากจนเป็นอันตรายถ้ามันเปลี่ยนรูปแบบคลื่นอย่างมาก ข่าวสารที่ส่งออกมายังคงสนับสนุนผู้ขายมากกว่าผู้ซื้อเมื่อมาถึงข้อมูลทางเศรษฐกิจ

Chin Zhao 20:10 2025-03-31 UTC+2

การวิเคราะห์ GBP/USD – 31 มีนาคม: เงินปอนด์หยุดพัก

โครงสร้างคลื่นสำหรับ GBP/USD ยังคงคลุมเครือเล็กน้อย แต่ถือว่ารับได้โดยรวม ปัจจุบันยังมีความเป็นไปได้สูงในการสร้างแนวโน้มขาลงระยะยาว คลื่น 5 ได้เกิดรูปร่างที่น่าเชื่อแล้ว ดังนั้นฉันจึงพิจารณาคลื่นใหญ่ 1 ว่าเสร็จสมบูรณ์ หากสมมติฐานนี้ถูกต้อง คลื่น 2 กำลังพัฒนาเป้าหมายรอบตัวเลข

Chin Zhao 20:08 2025-03-31 UTC+2

การพยากรณ์รายสัปดาห์โดยใช้การวิเคราะห์คลื่นแบบง่ายสำหรับ GBP/USD, AUD/USD, USD/CHF, EUR/JPY, #Ethereum และ #Litecoin ณ วันที่ 31 มีนาคม

GBP/USD การวิเคราะห์: การวิเคราะห์กราฟ 4 ชั่วโมงของเงินปอนด์อังกฤษเผยให้เห็นว่าแนวโน้มขึ้นจากวันที่ 13 มกราคมยังคงไม่เสร็จสมบูรณ์ ส่วนแรก (A) ได้เกิดขึ้นแล้ว ตั้งแต่ต้นเดือนมีนาคม ส่วนกลางของคลื่น (B) กำลังพัฒนาลักษณะการเคลื่อนที่เป็นแนวราบแคบเป็นที่ชัดเจนว่าแต่ยังไม่เสร็จสมบูรณ์ ในช่วงเวลาของการวิเคราะห์

Isabel Clark 11:43 2025-03-31 UTC+2

การคาดการณ์รายสัปดาห์ตามการวิเคราะห์คลื่นที่เรียบง่ายสำหรับ EUR/USD, USD/JPY, GBP/JPY, USD/CAD, #Bitcoin และ #Ripple – วันที่ 31 มีนาคม

EUR/USD การวิเคราะห์: ในระยะสั้น คู่สกุลเงิน EUR/USD ได้เดินตามแนวขาขึ้นล่าสุดที่เริ่มขึ้นตั้งแต่วันที่ 3 กุมภาพันธ์ปีนี้ ในช่วงไม่กี่สัปดาห์ที่ผ่านมา ราคาได้สร้างแนวแก้ไขในรูปแบบแบนที่ยืดออก ขณะนี้ โครงสร้างของคลื่นยังไม่เสร็จสมบูรณ์ ขณะนี้คู่เงินกำลังซื้อขายใกล้ขอบล่างของโซนกลับตัวที่เป็นไปได้ในกรอบเวลารายวัน การพยากรณ์: คาดว่าการเคลื่อนไหวลงของเงินยูโรจะเสร็จสิ้นในไม่กี่วันข้างหน้า

Isabel Clark 11:12 2025-03-31 UTC+2

การวิเคราะห์ EUR/USD – 28 มีนาคม

โครงสร้างคลื่นในกราฟ 4 ชั่วโมงสำหรับ EUR/USD มีแนวโน้มที่จะพัฒนาเป็นรูปแบบที่ซับซ้อนมากขึ้น โครงสร้างลงใหม่เริ่มก่อตัวในวันที่ 25 กันยายน โดยมีรูปแบบเป็นคลื่นห้า-wave ที่เต็มไปด้วยแรงกดดัน สองเดือนก่อนหน้า โครงสร้างขาขึ้นที่มีการแก้ไขเริ่มต้นขึ้นซึ่งควรประกอบด้วยอย่างน้อยสามคลื่น โครงสร้างคลื่นของคลื่นแรกค่อนข้างชัดเจน ดังนั้นฉันจึงคาดหวังว่าคลื่นที่สองจะมีรูปแบบที่ชัดเจนเช่นกัน แต่อย่างไรก็ตามขนาดของคลื่นนี้ใหญ่พอจนสามารถมีผลเปลี่ยนแปลงนับคลื่นปัจจุบันได้อย่างมาก

Chin Zhao 19:10 2025-03-28 UTC+2

วิเคราะห์ GBP/USD – 28 มีนาคม

โครงสร้างคลื่นของเครื่องมือ GBP/USD ยังคงค่อนข้างกำกวม แต่โดยรวมสามารถเข้าใจได้ ในขั้นตอนนี้มีความเป็นไปได้สูงว่ากำลังเกิดเซ็กเมนต์แนวโน้มขาลงในระยะยาว คลื่น 5 ได้มีรูปร่างที่ชัดเจนแล้ว ดังนั้นฉันถือว่าคลื่นย่อยใหญ่ 1 ได้จบลงแล้ว หากข้อสมมตินี้ถูกต้อง คลื่น 2 กำลังดำเนินการอยู่

Chin Zhao 19:07 2025-03-28 UTC+2

การวิเคราะห์ GBP/USD วันที่ 27 มีนาคม 2025

รูปแบบคลื่นของ GBP/USD ยังคงค่อนข้างไม่ชัดเจน แต่โดยรวมแล้วสามารถจัดการได้ ยังมีความเป็นไปได้สูงที่จะพัฒนาทิศทางลงในระยะยาว คลื่น 5 ได้มีรูปแบบที่ชัดเจนแล้ว ดังนั้นฉันพิจารณาว่าคลื่นหลักที่ 1 เสร็จสมบูรณ์แล้ว หากสมมติฐานนี้ถูกต้อง คลื่นที่ 2 กำลังอยู่ในระหว่างการพัฒนา

Chin Zhao 18:07 2025-03-27 UTC+2

การวิเคราะห์ค่าเงิน GBP/USD สำหรับวันที่ 26 มีนาคม 2025

รูปแบบคลื่นของ GBP/USD ยังคงมีความคลุมเครืออยู่บ้าง แต่โดยรวมแล้วก็สามารถใช้งานได้ ยังมีความน่าจะเป็นสูงที่จะเกิดแนวโน้มขาลงระยะยาวขึ้น โดยคลื่นที่ 5 ได้มีรูปร่างชัดเจน ดังนั้นฉันคิดว่าคลื่นใหญ่ 1 นั้นเสร็จสิ้นแล้ว หากสมมุติฐานนี้ถูกต้อง คลื่นที่ 2 กำลังพัฒนาอยู่

Chin Zhao 17:37 2025-03-26 UTC+2

การวิเคราะห์ GBP/USD วันที่ 25 มีนาคม 2025

รูปแบบของคลื่นสำหรับ GBP/USD ยังคงคลุมเครือแต่ยังพอจัดการได้ ปัจจุบันมีความเป็นไปได้สูงที่แนวโน้มขาลงระยะยาวกำลังก่อตัว คลื่นที่ 5 ได้ถือรูปแบบที่น่าเชื่อถือ ดังนั้นผมถือว่าคลื่นใหญ่ที่ 1 ได้เสร็จสิ้นแล้ว ถ้าสมมติฐานนี้ถูกต้อง คู่เงินนี้กำลังอยู่ในกระบวนการก่อตัวของคลื่น 2 ที่มุ่งเป้าไปรอบระดับ 1.26

Chin Zhao 18:36 2025-03-25 UTC+2

การพยากรณ์รายสัปดาห์โดยอิงจากการวิเคราะห์คลื่นที่เรียบง่ายสำหรับ GBP/USD, AUD/USD, USD/CHF, EUR/JPY, #Ethereum, #Litecoin – 24 มีนาคม

GBP/USD บทวิเคราะห์: กราฟรายวันของคู่สกุลเงินปอนด์แสดงให้เห็นถึงโครงสร้างคลื่นขาขึ้นที่ดำเนินมาอย่างต่อเนื่องตั้งแต่วันที่ 13 มกราคมของปีนี้ ส่วนกลางของคลื่น (B) กำลังพัฒนาในช่วงไม่กี่สัปดาห์ที่ผ่านมา คู่สกุลเงินกำลังสร้างรูปแบบ flat แบบหดตัวซึ่งยังไม่สมบูรณ์ การคาดการณ์: คาดว่าการเคลื่อนไหวของ GBP จะเป็นไปในทิศทางด้านข้างและมีลักษณะราบเรียบ

Isabel Clark 11:21 2025-03-24 UTC+2
หากไม่สะดวกคุยในตอนนี้
ระบุคำถามไว้ได้ใน แชท.
Widget callback
 

Dear visitor,

Your IP address shows that you are currently located in the USA. If you are a resident of the United States, you are prohibited from using the services of InstaFintech Group including online trading, online transfers, deposit/withdrawal of funds, etc.

If you think you are seeing this message by mistake and your location is not the US, kindly proceed to the website. Otherwise, you must leave the website in order to comply with government restrictions.

Why does your IP address show your location as the USA?

  • - you are using a VPN provided by a hosting company based in the United States;
  • - your IP does not have proper WHOIS records;
  • - an error occurred in the WHOIS geolocation database.

Please confirm whether you are a US resident or not by clicking the relevant button below. If you choose the wrong option, being a US resident, you will not be able to open an account with InstaForex anyway.

We are sorry for any inconvenience caused by this message.