empty
was formed on 29.03 at 11:00:31 (UTC+0)
signal strength 3 of 5
Double Bottom #Bitcoin M30

The Double Bottom pattern has been formed on #Bitcoin M30. Characteristics: the support level 83552.05; the resistance level 84588.82; the width of the pattern 103677 points. If the resistance level is broken, a change in the trend can be predicted with the first target point lying at the distance of 96966 points.

Figure
  • All
  • Double Top
  • Flag
  • Head and Shoulders
  • Pennant
  • Rectangle
  • Triangle
  • Triple top
Instrument
  • All
  • #AAPL
  • #AMZN
  • #Bitcoin
  • #EBAY
  • #FB
  • #GOOG
  • #INTC
  • #KO
  • #MA
  • #MCD
  • #MSFT
  • #NTDOY
  • #PEP
  • #TSLA
  • #TWTR
  • AUDCAD
  • AUDCHF
  • AUDJPY
  • AUDUSD
  • EURCAD
  • EURCHF
  • EURGBP
  • EURJPY
  • EURNZD
  • EURRUB
  • EURUSD
  • GBPAUD
  • GBPCHF
  • GBPJPY
  • GBPUSD
  • GOLD
  • NZDCAD
  • NZDCHF
  • NZDJPY
  • NZDUSD
  • SILVER
  • USDCAD
  • USDCHF
  • USDJPY
  • USDRUB
Timeframe
  • All
  • M5
  • M15
  • M30
  • H1
  • D1
Trend
  • All
  • Buy
  • Sale
Signal Strength
  • All
  • 1
  • 2
  • 3
  • 4
  • 5
Triângulo Simétrico de Baixa
was formed on 22.04 at 00:02:54 (UTC+0)
signal strength 2 of 5
Triângulo Simétrico de Baixa USDJPY M15

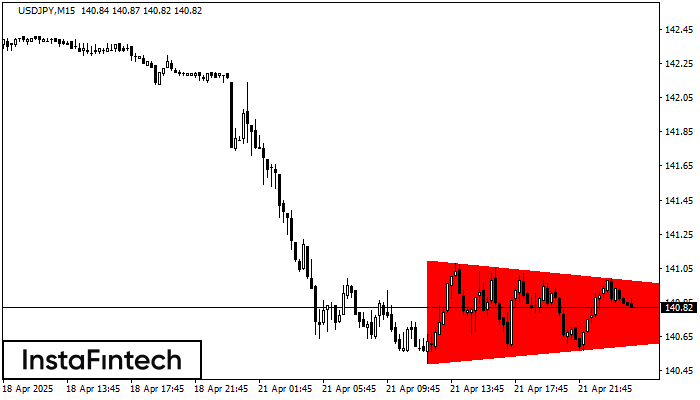
De acordo com o gráfico de M15, USDJPY formou o padrão de Triângulo Simétrico de Baixa. Recomendações de negociação: Uma quebra do limite inferior de 140.49 pode encorajar a continuação

Os intervalos M5 e M15 podem ter mais pontos de entrada falsos.

Open chart in a new window
Cabeça & Ombro Invertidos
was formed on 22.04 at 00:00:27 (UTC+0)
signal strength 1 of 5
Cabeça & Ombro Invertidos AUDUSD M5

De acordo com o gráfico de M5, AUDUSD produziu o padrão denominado Cabeça & Ombro Invertidos. A Cabeça é definida em 0.6402 enquanto a linha mediana do Pescoço é definida

Os intervalos M5 e M15 podem ter mais pontos de entrada falsos.

Open chart in a new window
Triângulo Simétrico de Baixa
was formed on 21.04 at 23:42:32 (UTC+0)
signal strength 3 of 5
Triângulo Simétrico de Baixa NZDJPY M30

De acordo com o gráfico de M30, NZDJPY formou o padrão Triângulo Simétrico de Baixa. Descrição: o limite inferior é 83.98/84.43 e o limite superior é 84.90/84.43. A largura

Open chart in a new window
¿No puede hablar ahora mismo?
Ingrese su pregunta en el chat.
Widget callback
 

Dear visitor,

Your IP address shows that you are currently located in the USA. If you are a resident of the United States, you are prohibited from using the services of InstaFintech Group including online trading, online transfers, deposit/withdrawal of funds, etc.

If you think you are seeing this message by mistake and your location is not the US, kindly proceed to the website. Otherwise, you must leave the website in order to comply with government restrictions.

Why does your IP address show your location as the USA?

  • - you are using a VPN provided by a hosting company based in the United States;
  • - your IP does not have proper WHOIS records;
  • - an error occurred in the WHOIS geolocation database.

Please confirm whether you are a US resident or not by clicking the relevant button below. If you choose the wrong option, being a US resident, you will not be able to open an account with InstaForex anyway.

We are sorry for any inconvenience caused by this message.