empty
19.08.2024 02:52 PM
Forecast for EUR/USD pair on August 19, 2024

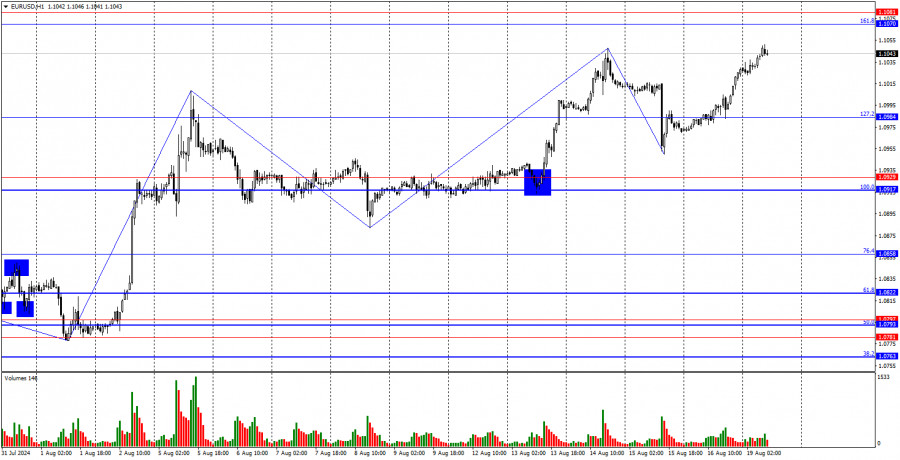
On Friday, the EUR/USD pair consolidated above the 127.2% corrective level at 1.0984 and continued to rise towards the 161.8% Fibonacci level at 1.1070. Judging by the size of the waves and corrections, it seems that the bullish momentum is fading. The corrections are becoming deeper, and the bullish waves are getting weaker. Therefore, I do not expect the pair to sustain its position above the 1.1070 level. A rebound from this level would benefit the U.S. dollar and could trigger a decline towards the support zone between 1.0917 and 1.0929.

This image is no longer relevant

The wave structure has become slightly more complex, but overall it remains clear. The last completed wave down did not break the low of the previous wave. The new wave up has already broken the peak from August 14, albeit by only a few points. If a more significant breakout does not occur, it may indicate the end of the bullish trend. However, the bullish trend remains intact. To negate this trend, the bears need to break the low of the last wave down, which is around the 1.0950 level.

The fundamental backdrop on Friday once again did nothing to help the U.S. dollar. The University of Michigan's Consumer Sentiment Index came in slightly above traders' expectations, but the earlier report on building permits was worse than expected. We might have expected at least a halt in the decline of the U.S. currency, if not an increase, but it appears the bulls are making a final push, aiming to elevate the pair as much as possible before the anticipated bearish trend. As we can see, the fundamental backdrop no longer serves as a clear reason for market purchases or sales. This indicates that the bullish trend is nearing its end—unless the fundamentals provide the bulls with new reasons to attack aggressively, which cannot be ruled out, as the U.S. has released quite a bit of negative information over the past 3-4 months, contributing significantly to the dollar's decline.

This image is no longer relevant

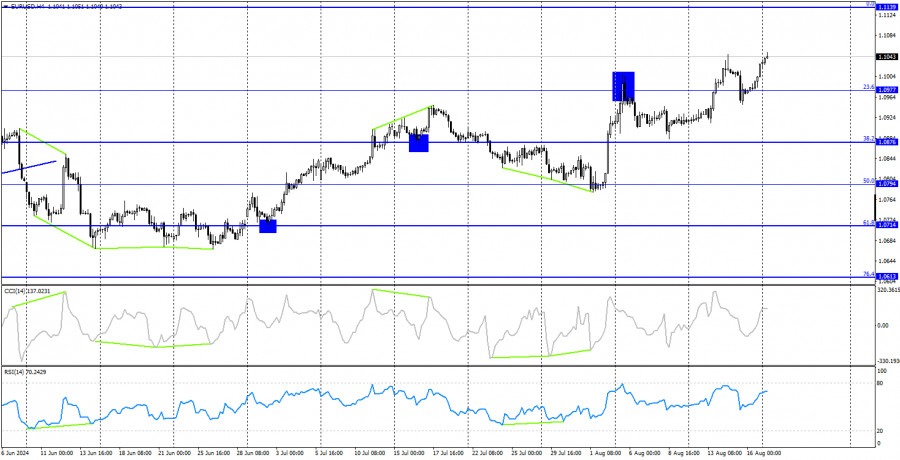
On the 4-hour chart, the pair reversed in favor of the euro around the 38.2% corrective level at 1.0876 and initiated a new upward movement. The consolidation above the 23.6% Fibonacci level at 1.0977 suggests that the pair could continue to rise towards the next corrective level at 0.0% – 1.1139. No impending divergences are observed on any indicators. In my opinion, the current growth does not fully align with the fundamental backdrop, but the technical picture still clearly indicates a bullish trend with no signs of ending.

Commitments of Traders (COT) Report:

This image is no longer relevant

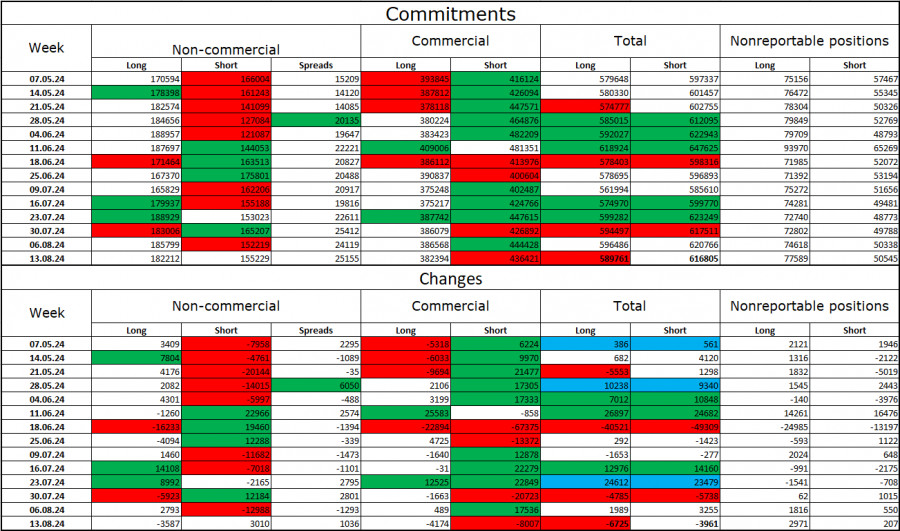
During the last reporting week, speculators closed 3,587 long positions and opened 3,010 short positions. The sentiment of the "Non-commercial" group turned bearish several months ago, but currently, the bulls are once again dominating. The total number of long positions held by speculators is now 182,000, while short positions amount to 155,000.

I still believe that the situation will continue to shift in favor of the bears. I see no long-term reasons to buy the euro, as the ECB has begun easing its monetary policy, which will reduce the yield on bank deposits and government bonds. In the U.S., however, yields are expected to remain high at least until September, making the dollar more attractive to investors. The potential for a decline in the euro looks substantial. However, it is important not to overlook the technical analysis, which currently does not allow for a confident prediction of a sharp decline in the euro, and the fundamental backdrop, which continues to pose challenges for the dollar.

News Calendar for the U.S. and Eurozone:

The economic calendar for August 19 does not contain any noteworthy entries. The fundamental backdrop is not expected to influence traders' sentiment today.

EUR/USD Forecast and Trading Advice:

Selling the pair today could be considered if there is a rebound from the 1.1070 level on the hourly chart, with targets at 1.0984 and 1.0929. I would now approach buying with caution, as the bullish trend is fading, and without new data that would pressure the dollar, it will be difficult for the pair to continue rising.

The Fibonacci levels are plotted between 1.0917 and 1.0668 on the hourly chart, and between 1.0450 and 1.1139 on the 4-hour chart.

Pilih carta masa
5
min
15
min
30
min
1
jam
4
jam
1
hari
1
minggu
Jana pendapatan melalui perubahan kadar mata wang kripto dengan InstaForex.
Muat turun MetaTrader 4 dan buka dagangan pertama anda.
  • Grand Choice
    Contest by
    InstaForex
    InstaForex always strives to help you
    fulfill your biggest dreams.
    SERTAI PERADUAN

Artikel yang dicadangkan

Analisis Teknikal Pergerakan Harga harian bagi Pasangan Mata Wang Komoditi USD/CAD, Rabu, 09 April 2025.

Walaupun pada carta 4 jam pasangan mata wang komoditi USD/CAD bergerak dalam saluran Menurun, tetapi dengan pembentukan corak Bullish 123 dan berada di atas SMA 20 (Garis Tengah Bollinger Band)

Arief Makmur 07:11 2025-04-09 UTC+2

Ramalan EUR/USD untuk 9 April 2025

Menjelang penghujung dagangan hari Selasa, euro telah mencatat kenaikan sebanyak 45 pip, dan dalam sesi dagangan Pasifik hari ini, ia telah menambah jumlah yang hampir sama, menghampiri paras sasaran 1.1027

Laurie Bailey 04:31 2025-04-09 UTC+2

Ramalan GBP/USD untuk 9 April 2025

Pada hari Selasa, pound British telah menguji had bawah julat sasaran pada 1.2816/47 dengan bayangan atas. Pagi ini, harga berjaya bergerak dalam julat ini. Pengukuhan di atas julat ini akan

Laurie Bailey 04:31 2025-04-09 UTC+2

Ramalan AUD/USD untuk 9 April 2025

Usaha dolar Australia untuk naik pada hari Isnin dan Selasa menuju ke tahap sasaran 0.6133 telah dihentikan (seperti yang ditunjukkan oleh bayang atas yang panjang), tetapi pasangan mata wang

Laurie Bailey 04:31 2025-04-09 UTC+2

Isyarat Dagangan EMAS (XAU/USD) untuk 8-10 April 2025: beli di atas $2,993 (200 EMA - lantunan semula)

Rancangan dagangan kami untuk beberapa jam akan datang ialah menjual emas di bawah 3,020, kerana secara teknikal terdapat saluran aliran menurun. Jika emas gagal menembusi paras ini, ia akan dianggap

Dimitrios Zappas 14:56 2025-04-08 UTC+2

Isyarat Dagangan untuk EUR/USD bagi 8-10 April 2025: jual di bawah 1.0986 (200 EMA - 6/8 Murray)

Jika euro menembusi saluran aliran menurun, kita dapat menjangkakan pergerakan menaik baru yang boleh mendorong EUR/USD sehingga 1.1051, paras tertinggi minggu lalu, 7/8 Murray pada 1.1115, dan juga berpotensi melebihi

Dimitrios Zappas 14:54 2025-04-08 UTC+2

Ramalan untuk EUR/USD pada 8 April 2025

Pada hari Isnin, pasangan EUR/USD membuat dua lantunan dari tahap pengunduran 76.4%, beralih memihak kepada euro, dan berjaya kukuh di atas zon 1.0944–1.0957. Hasilnya, pergerakan menaik mungkin terus menuju

Samir Klishi 10:57 2025-04-08 UTC+2

Ramalan untuk GBP/USD pada 8 April 2025

Pada carta setiap jam, pasangan GBP/USD meneruskan penurunannya pada hari Isnin dan mengakhiri hari berhampiran tahap 1.2709. Dalam hanya dua hari dagangan, pound jatuh sekitar 500 mata. Pemulihan dari tahap

Samir Klishi 10:53 2025-04-08 UTC+2

Analisis Teknikal Pergerakan Harga Intraday Instrumen Komoditi Emas, Selasa 08 April 2025.

Setelah munculnya Perbezaan antara pergerakan harga Emas dengan penunjuk Pengayun Stochastic pada carta 4 jam, dan disahkan pula oleh pergerakan harga semasa yang berada di bawah WMA (30 Shift 2)

Arief Makmur 09:32 2025-04-08 UTC+2

Analisis Teknikal Pergerakan Harga Harian Instrumen Komoditi Minyak Mentah, Selasa 08 April 2025.

Dengan kemunculan Konvergensi antara pergerakan harga harian instrumen komoditi Minyak Mentah dan penunjuk Pengayun Stochastic, ia mengesahkan bahawa dalam beberapa hari akan datang, bias #CL masih berada di bawah tekanan

Arief Makmur 09:32 2025-04-08 UTC+2
Tidak boleh bertanya sekarang?
Tanya soalan anda di Ruangan bersembang.
Panggilan semula Widget
 

Dear visitor,

Your IP address shows that you are currently located in the USA. If you are a resident of the United States, you are prohibited from using the services of InstaFintech Group including online trading, online transfers, deposit/withdrawal of funds, etc.

If you think you are seeing this message by mistake and your location is not the US, kindly proceed to the website. Otherwise, you must leave the website in order to comply with government restrictions.

Why does your IP address show your location as the USA?

  • - you are using a VPN provided by a hosting company based in the United States;
  • - your IP does not have proper WHOIS records;
  • - an error occurred in the WHOIS geolocation database.

Please confirm whether you are a US resident or not by clicking the relevant button below. If you choose the wrong option, being a US resident, you will not be able to open an account with InstaForex anyway.

We are sorry for any inconvenience caused by this message.