Analysis of Wednesday's Trades
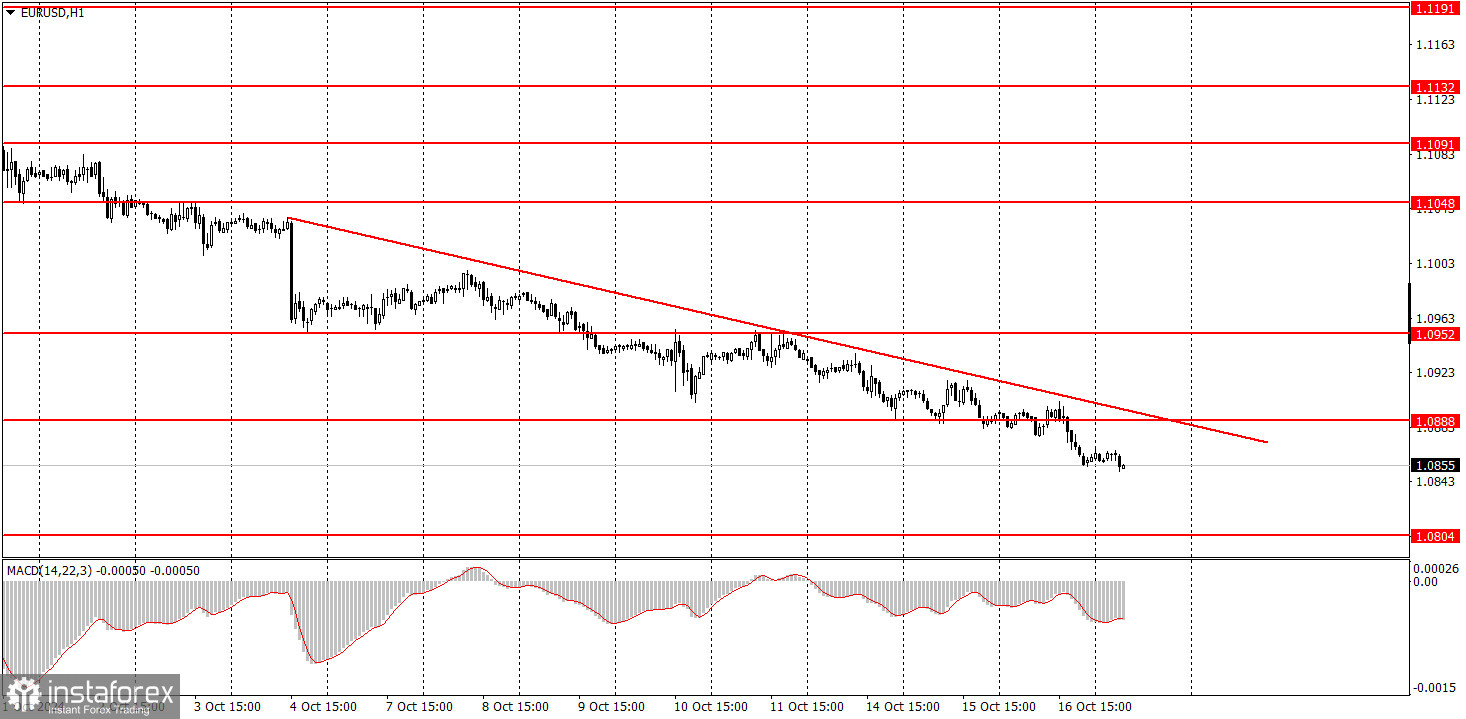
1H Chart of the EUR/USD Pair
On Wednesday, the EUR/USD currency pair continued its downward movement. A week ago, we mentioned that this movement didn't surprise us, even though novice traders might notice that there are no specific local reasons for the euro to fall daily. This indicates that the market is consistently selling the euro in small portions. This is the key point. After two years of growth in the euro, the time has come to bring the pair's rate to a fair value. Previously, the U.S. dollar was continuously falling as the market priced in the future easing of monetary policy, but now it's the euro that keeps dropping because the market has already priced in this easing.
Moreover, today, the European Central Bank may lower rates for the third time, a factor the market had not previously considered. From a technical standpoint, the price is below the trendline and is not even attempting to consolidate above it. Therefore, even technically, there are no reasons to buy or expect the pair to rise at the moment.
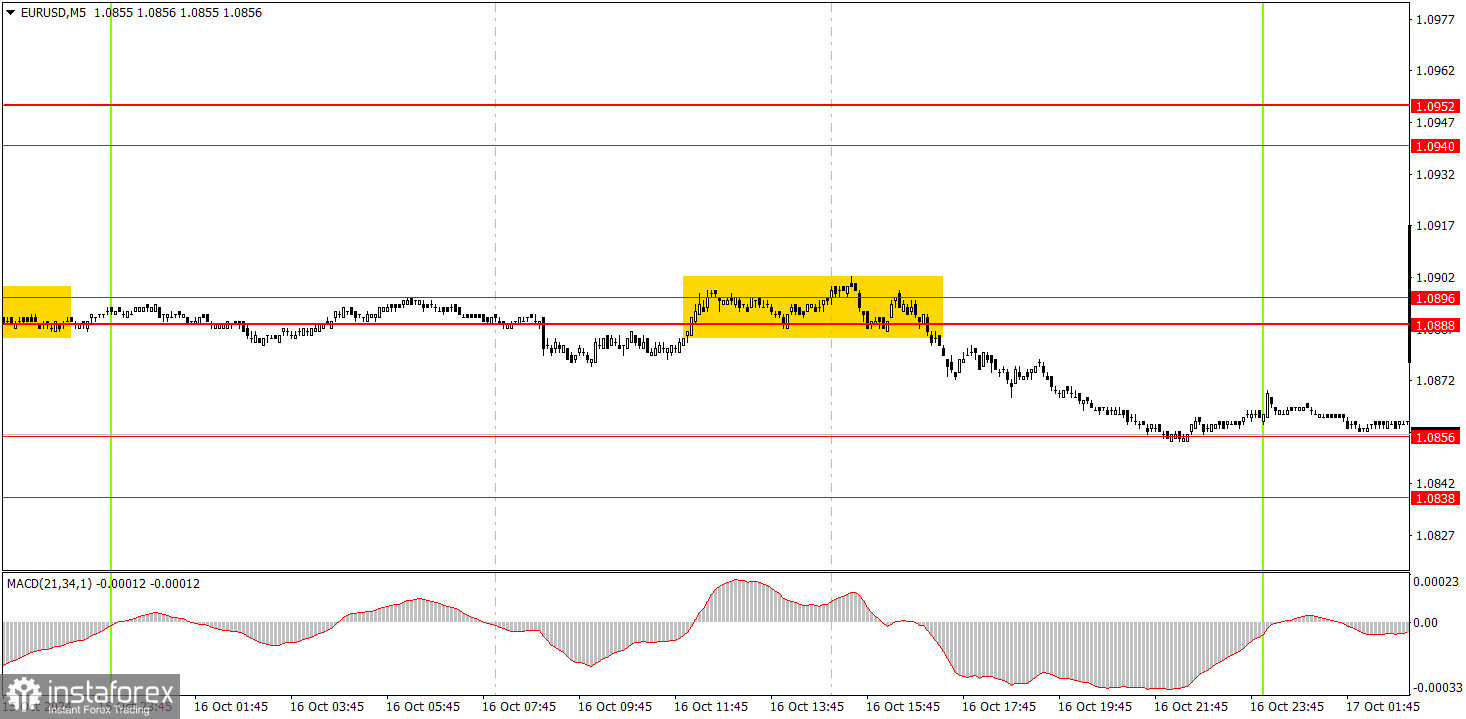
5M Chart of the EUR/USD Pair
Exactly one trading signal was formed in the 5-minute time frame on Wednesday. At the overlap of the European and U.S. trading sessions, the price entered the area of 1.0888-1.0896, consolidated there for several hours, and then started a new round of decline, reaching the 1.0856 level by the end of the day. Volatility remains weak, making it quite challenging to trade and expect profit on lower time frames. Nevertheless, it was possible to make a profit yesterday.
How to Trade on Thursday:
The EUR/USD pair continues its first step toward a new downward trend in the hourly time frame. At this point, it already looks like a leap. Unfortunately, illogical dollar sales could resume in the medium term, as no one knows how long the market will continue pricing in the Federal Reserve's monetary easing. However, the pair still shows a clear downtrend in the hourly time frame. We can expect further declines in the euro without a correction, as it remains highly overbought, but a correction would be more aesthetically pleasing.
On Wednesday, trading can be based on the nearest levels. Today's fundamental and macroeconomic backgrounds will be quite strong, so higher volatility can be expected.
In the 5-minute time frame, consider the following levels: 1.0726-1.0733, 1.0797-1.0804, 1.0838-1.0856, 1.0888-1.0896, 1.0940-1.0951, 1.1011, 1.1048, 1.1091, 1.1132-1.1140, 1.1189-1.1191. On Thursday, the ECB will announce the results of its meeting, followed by a press conference with Christine Lagarde. In the U.S., several less significant reports will be released, including industrial production and retail sales.
Basic Rules of the Trading System:
- The strength of a signal is determined by the time it takes to form (bounce or break through a level). The less time it takes, the stronger the signal.
- If two or more trades were opened near a particular level based on false signals, all subsequent signals from that level should be ignored.
- In a flat market, any pair can generate a lot of false signals or none at all. In any case, it's best to stop trading at the first signs of a flat market.
- Trades should be opened during the period between the start of the European session and the middle of the US session, after which all trades should be manually closed.
- In the hourly time frame, it's preferable to trade based on MACD signals only when there is good volatility and a trend confirmed by a trendline or trend channel.
- If two levels are very close to each other (between 5 and 20 pips), they should be treated as a support or resistance zone.
- When moving 15 pips in the intended direction, a Stop Loss should be set to breakeven.
What's on the Charts:
Support and Resistance Price Levels: These levels serve as targets when opening buy or sell positions. They can also be used as points to set Take Profit levels.
Red Lines: These represent channels or trend lines that display the current trend and indicate the preferred trading direction.
MACD Indicator (14,22,3): The histogram and signal line serve as an auxiliary indicator that can also be used as a source of trading signals.
Important Speeches and Reports (always found in the news calendar) can significantly impact the movement of a currency pair. Therefore, trading should be done with maximum caution during their release, or you may choose to exit the market to avoid a sharp price reversal against the preceding movement.
For Beginners Trading on the Forex Market: It's essential to remember that not every trade will be profitable. Developing a clear strategy and practicing money management is key to achieving long-term success in trading.