EUR/USD
Analysis:
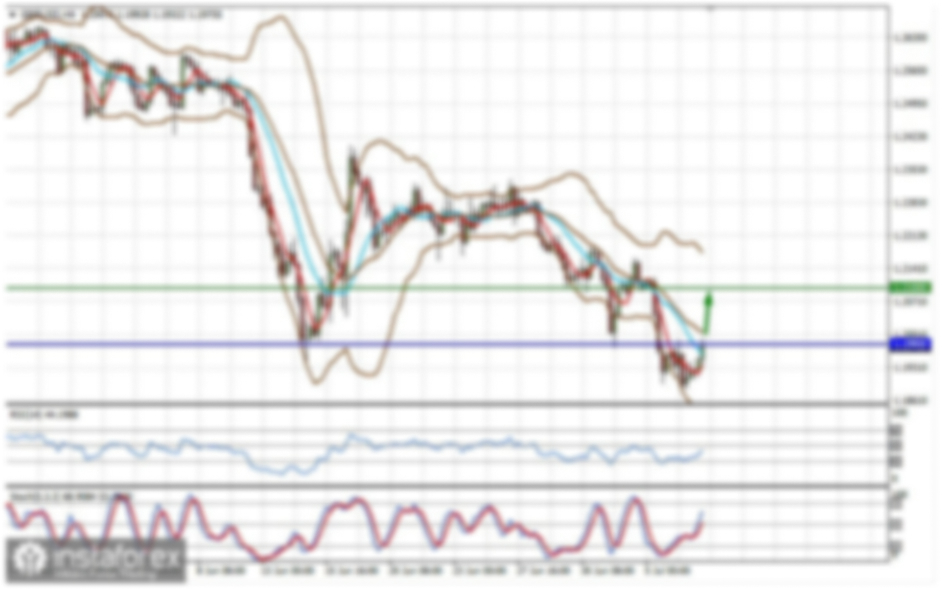
The euro has been moving in an upward trend. Since the end of August, a corrective zigzag has been forming from the resistance zone. The price is currently fluctuating between intermediate support and strong resistance, forming a correction. Its structure, at the time of analysis, is not yet complete.
Forecast:
During the upcoming week, the recent decline in the euro is expected to end near the calculated support area. Afterward, a reversal is likely, with the price rising toward the resistance zone by the end of the week.
Potential Reversal Zones:
- Resistance: 1.1230/1.1280
- Support: 1.0960/1.0910
Recommendations:
- Selling: Risky and not recommended.
- Buying: Possible with a fractional volume after reversal signals appear near the support zone.
USD/JPY
Analysis:
Since early August, a reversal pattern has been forming in the Japanese yen market, potentially leading to a trend change in the yen's value against the U.S. dollar. The wave appears to be an extended flat pattern, with the final part (C) currently forming. The structure is not yet complete. The lower boundary of the target zone lies near the resistance level.
Forecast:
At the start of the upcoming week, further upward movement is expected, with the price likely reaching the resistance area. Afterward, a reversal and price decline are expected. The highest volatility is likely to occur following news releases.
Potential Reversal Zones:
- Resistance: 150.00/150.50
- Support: 147.30/146.80
Recommendations:
- Selling: Recommended after reversal signals appear near the resistance zone on your trading systems.
- Buying: Limited potential, could lead to losses.
GBP/JPY
Analysis:
For the past two years, the GBP/JPY trend has been driven by an upward wave. In the short term, the ongoing wave started in early August. The middle part (B) of this wave is nearing completion but remains incomplete.
Forecast:
In the coming days, continued upward movement is expected, with the price moving towards the resistance zone. In the latter half of the week, conditions for a reversal and resumption of the upward trend are likely to form. The resistance area marks the upper boundary of the potential weekly range for the pair.
Potential Reversal Zones:
- Resistance: 195.60/196.10
- Support: 191.80/191.30
Recommendations:
- Buying: Possible with fractional volumes within individual sessions. Keep in mind the limited growth potential.
- Selling: Not recommended until confirmed reversal signals appear on your trading systems.
USD/CAD
Analysis:
Weekly analysis of the Canadian dollar chart shows an upward zigzag forming since the end of August. The wave structure represents an extended flat, with the final part (C) currently forming. The preliminary target zone lies near the lower boundary of the potential reversal zone, between 1.3550/1.3500.
Forecast:
In the beginning of the upcoming week, sideways movement is expected, with a potential decline toward the support zone. The latter half of the week is anticipated to be more volatile, with increased activity and resumption of the pair's upward trend.
Potential Reversal Zones:
- Resistance: 1.3680/1.3730
- Support: 1.3550/1.3500
Recommendations:
- Selling: Not recommended during the early days of the week.
- Buying: Recommended after appropriate signals appear near the support zone for trading.
EUR/CHF
Analysis:
Since early August, the EUR/CHF pair has been following an upward wave. The wave's highs and lows form a horizontal pennant pattern. The final part (C) is still incomplete. The price is currently near the support area of the higher time frame.
Forecast:
At the beginning of the week, sideways movement with a downward bias is likely. The price is expected to decline toward the support zone. After reaching this area, a reversal and a rise in the pair's price can be anticipated.
Potential Reversal Zones:
- Resistance: 0.9530/0.9580
- Support: 0.9400/0.9350
Recommendations:
- Buying: Becomes relevant after reversal signals appear near the support zone on your trading systems.
- Selling: Risky and offers limited potential.
Gold
Analysis:
Since August, the short-term trend of gold has been guided by an upward wave. On a higher time frame, this section represents the final part of the upward impulse. Since late September, the price has been moving sideways as part of a corrective pattern. At the time of analysis, the correction remains incomplete.
Forecast:
At the start of the upcoming week, the downward correction is expected to end. Afterward, a reversal near the support zone and a resumption of the upward trend are likely, with the price rising toward the resistance zone.
Potential Reversal Zones:
- Resistance: 2720.0/2740.0
- Support: 2630.0/2610.0
Recommendations:
- Selling: High risk and limited potential, could lead to losses.
- Buying: Can be considered after confirmed signals in the support zone on your trading systems.
Explanation:
In simplified wave analysis (SWA), all waves consist of 3 parts (A-B-C). The analysis focuses on the last, incomplete wave on each time frame. Dotted lines indicate expected movements.
Note: The wave algorithm does not account for the duration of market movements!